16. Exploring the render Performance of the National Rail website
💡 Would you like more free lessons? Please subscribe on YouTube to show your support.
Lesson Details
- Lesson: 16
- Description: Using the Layers Panel to Diagnose Performance issues
The goal of this lesson
To improve the performance of the National Rail website.
What we'll cover
- Introduction
- Performance Profiling
- Layers Panel
- Changing the z-index
- Conclusion
Introduction
The National Rail website occasionally uses an ad which has some interesting performance implications. This version is hosted at nationalrail.umaar.now.sh, as the production version of the site may not always present such behaviour.
Performance Profiling
We can use the Performance Monitor (Cmd + Shift + P > Show Performance Monitor) to view a high-level overview of the National Rail website.
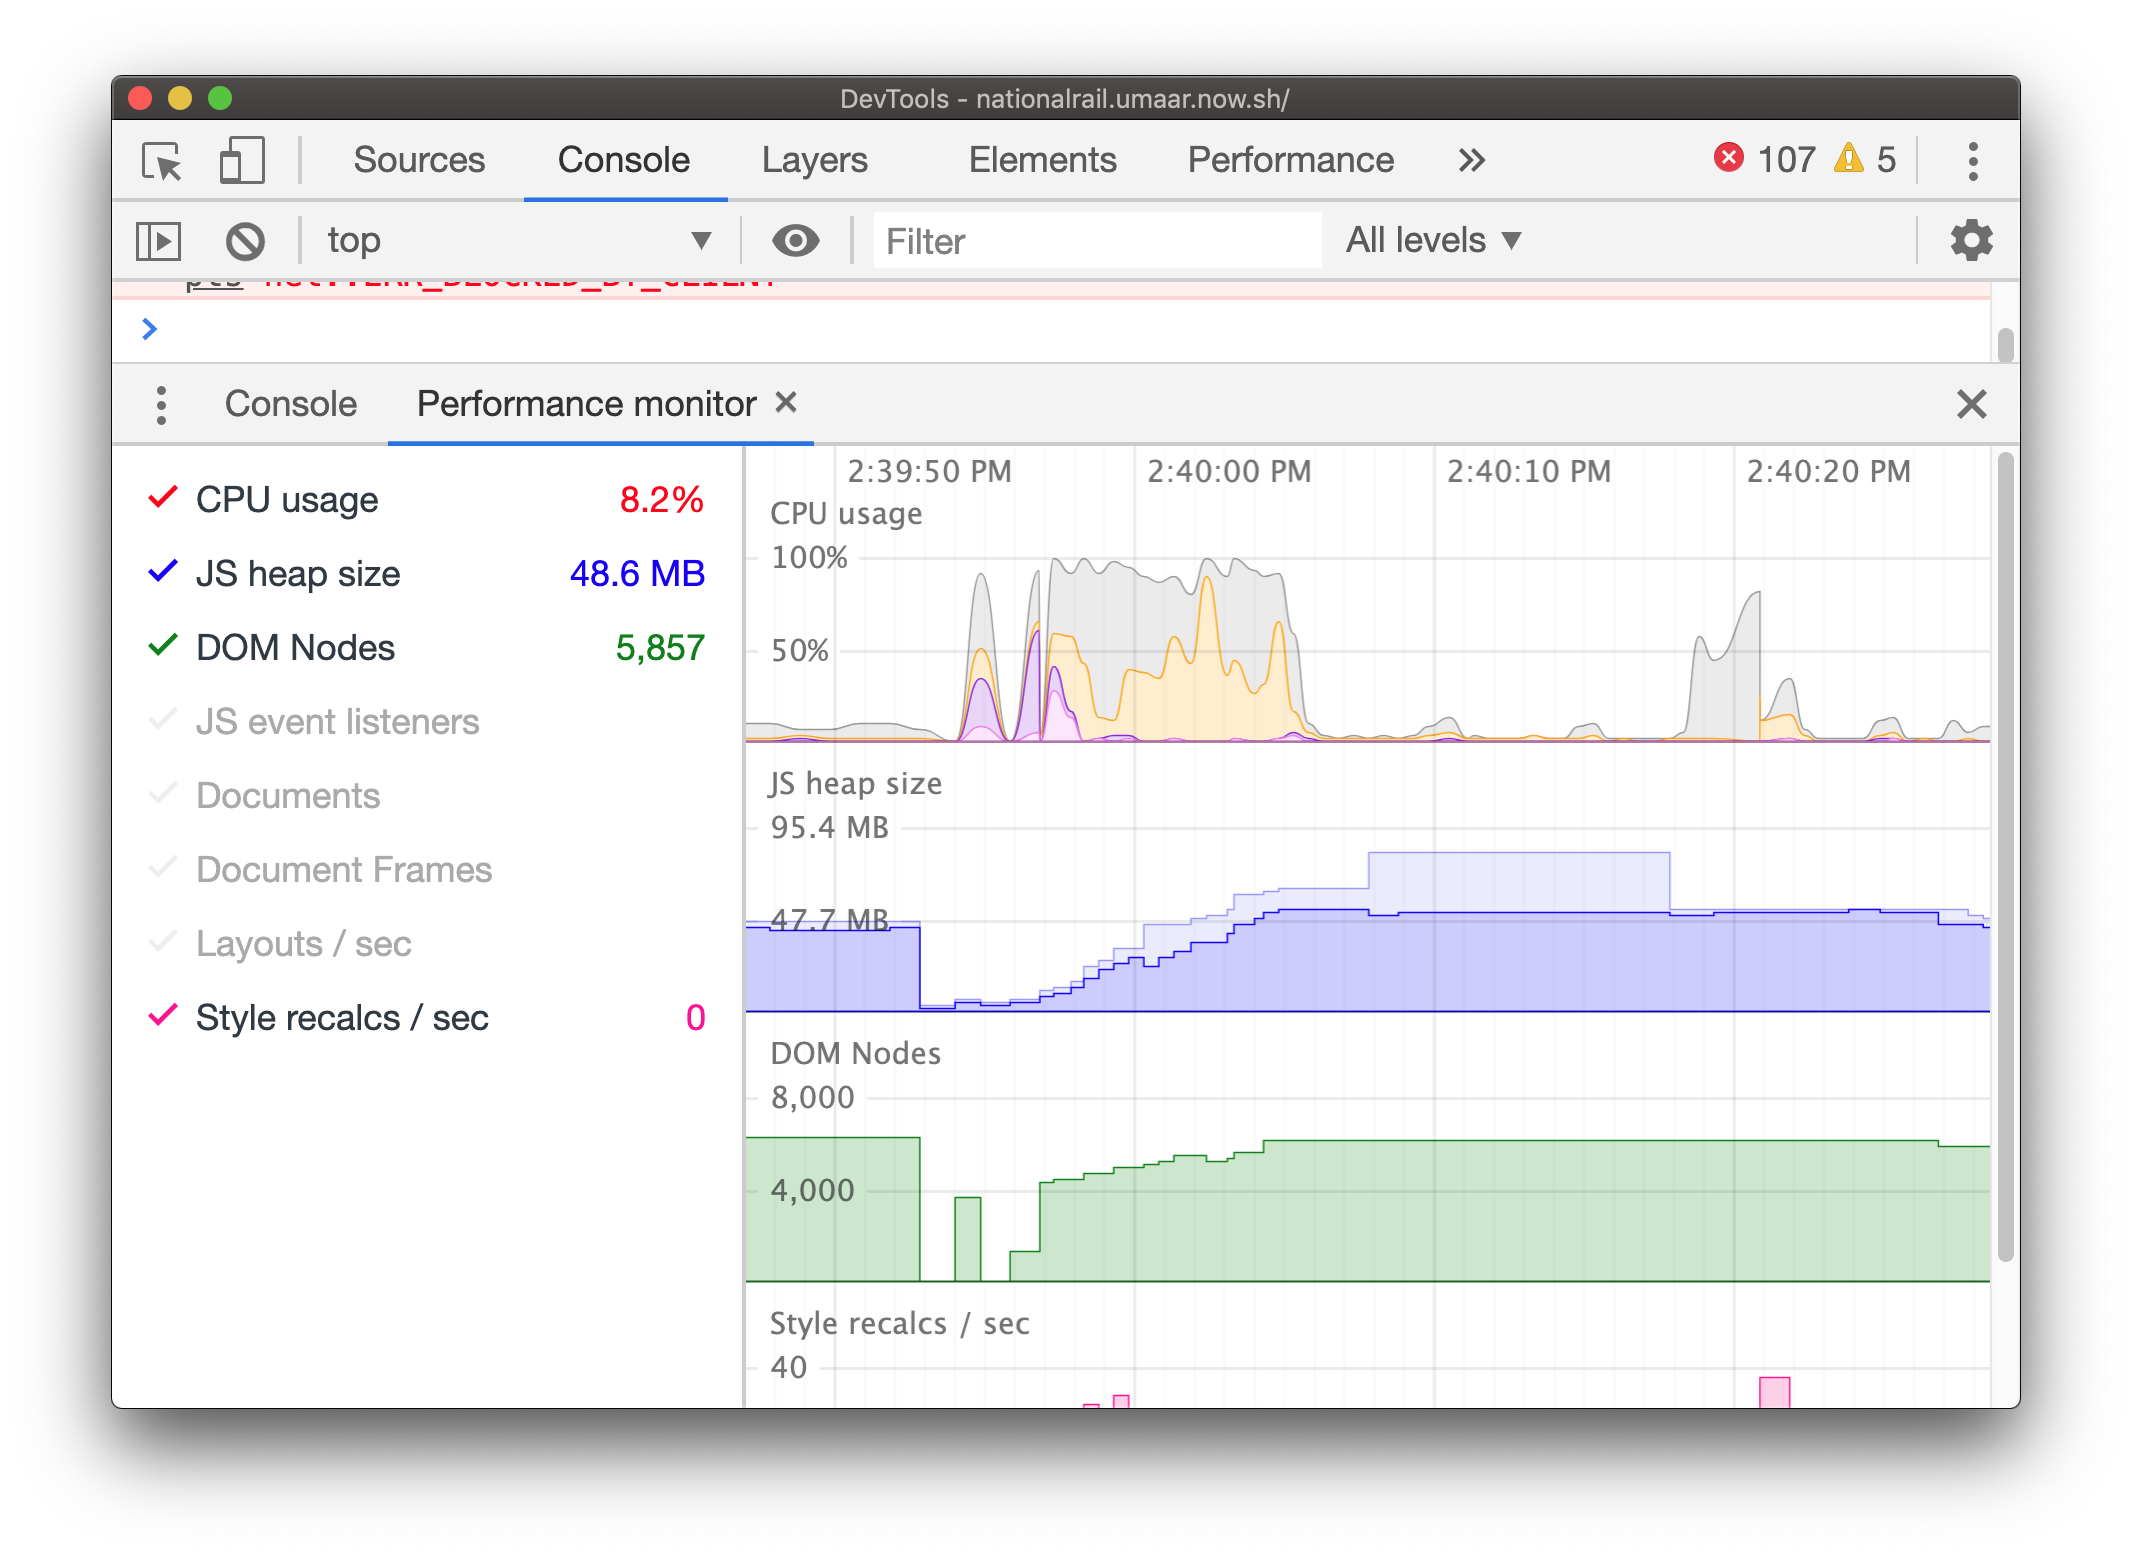
If for example, the DOM Nodes graph is spiking, this gives you a specific area on what to look at next.
You can record a performance profile in the Performance Panel, which provides much more detail than the Performance Monitor.
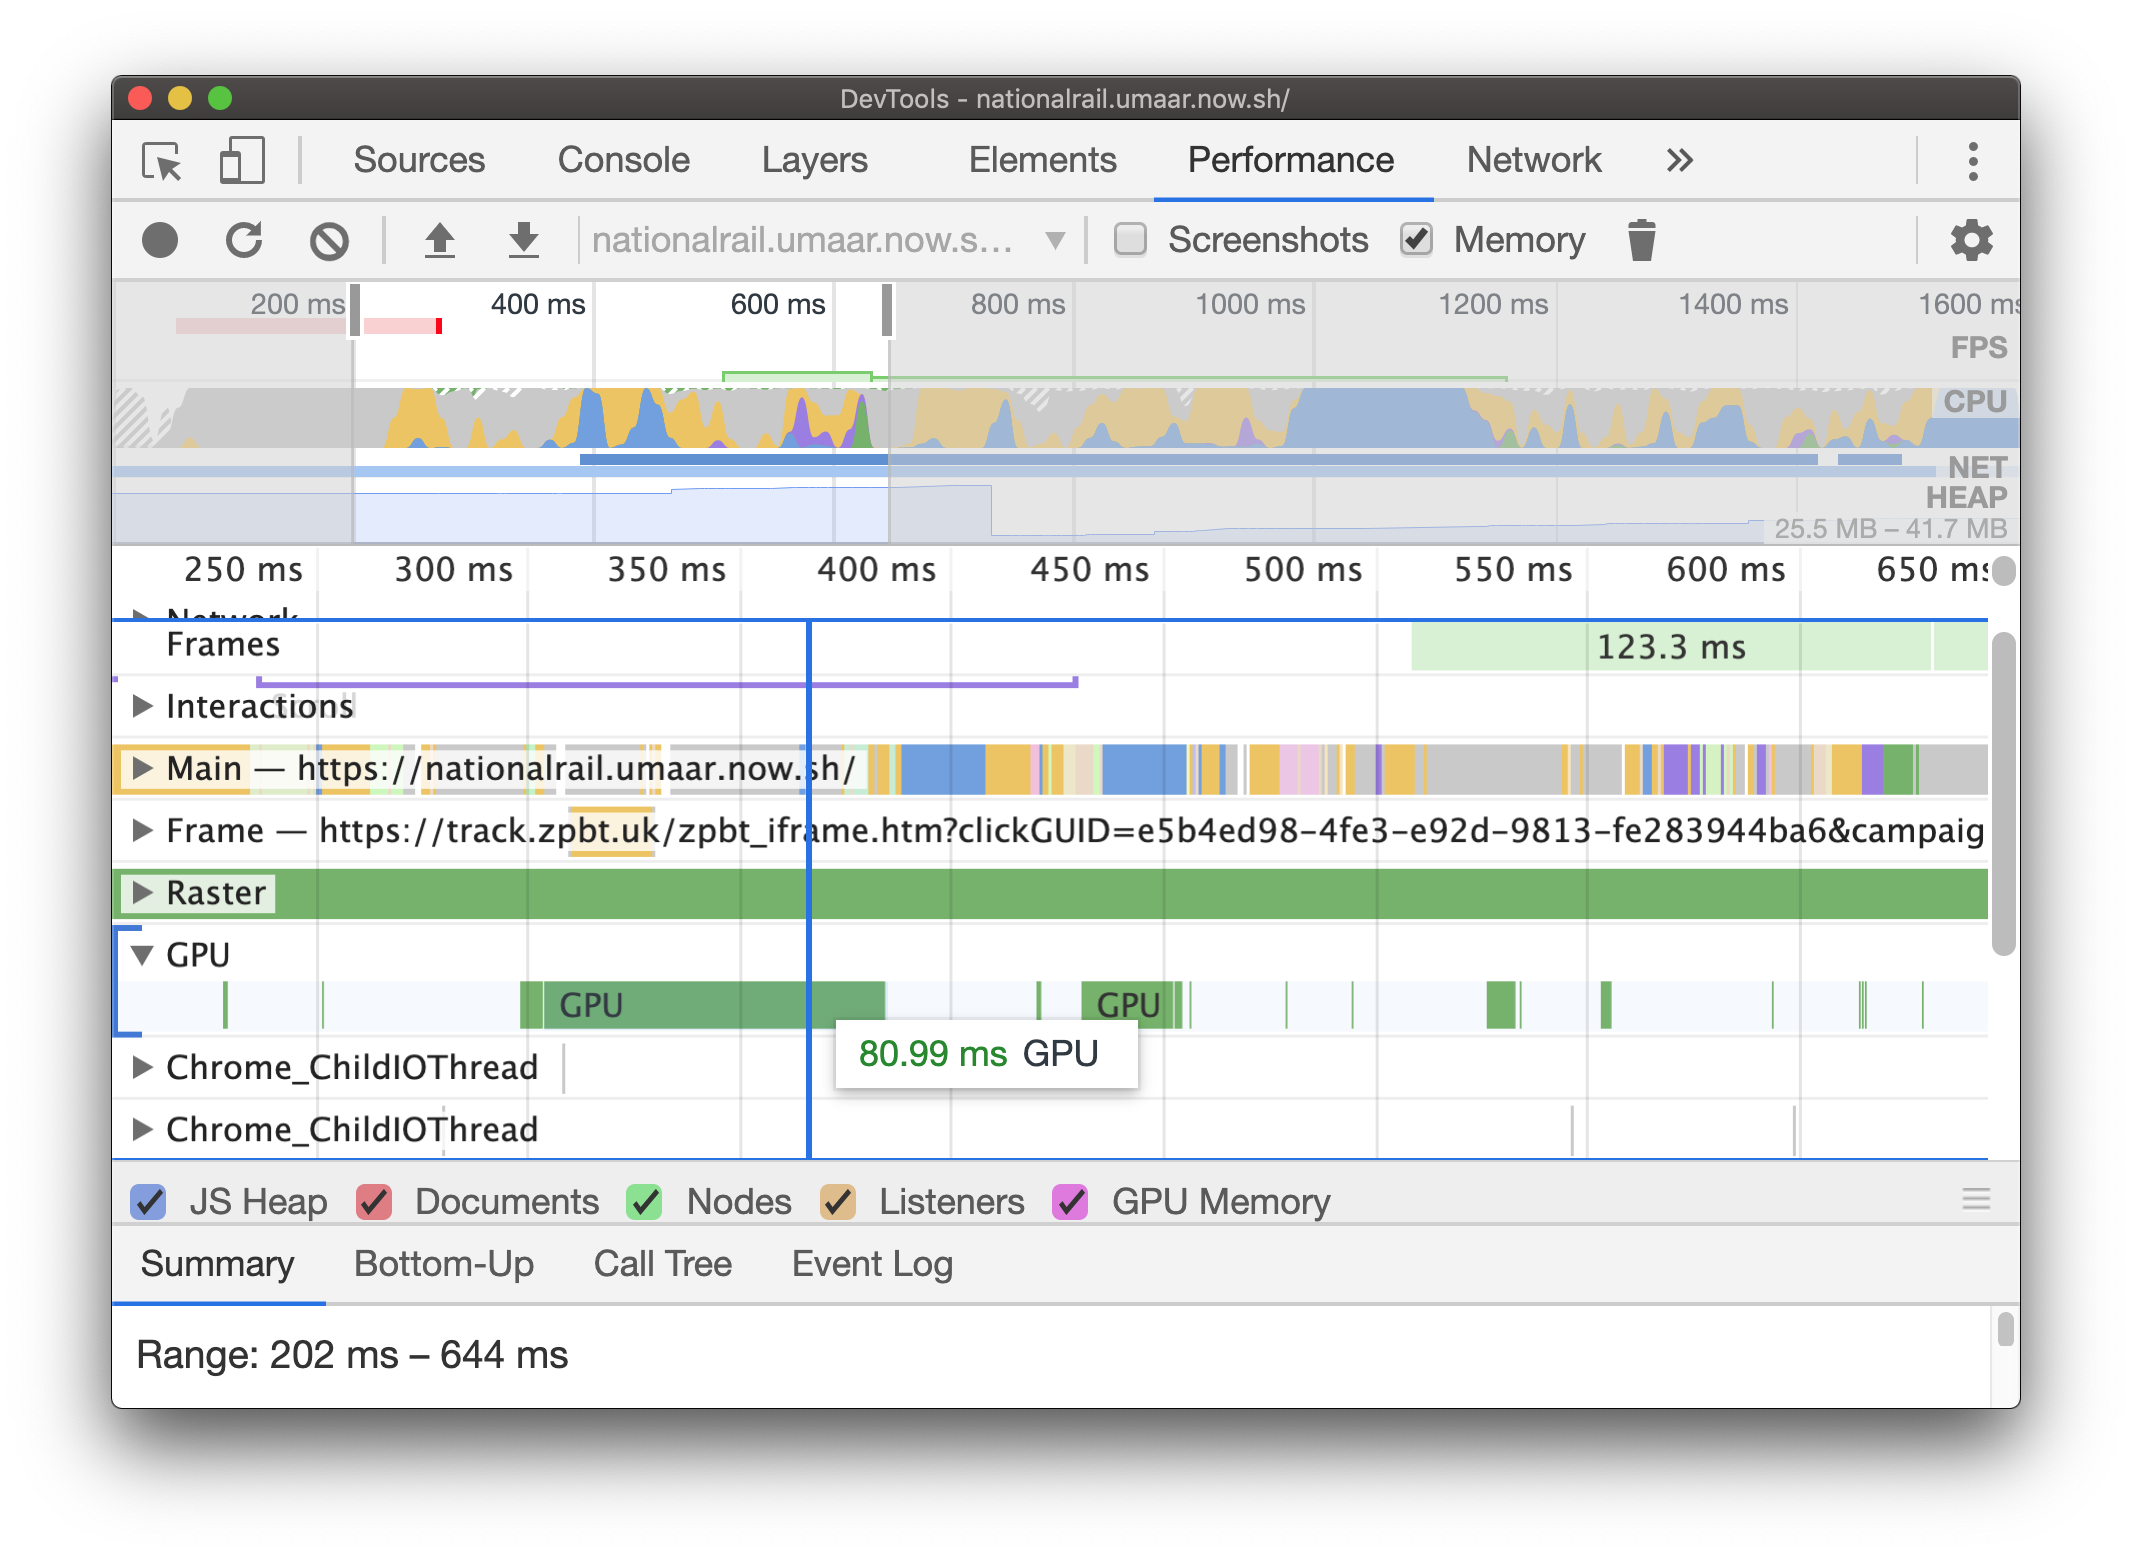
In the case of this performance recording, while the GPU events are not the slowest thing here, they're still a little slower than expected, this prompts us to open the Layers Panel (Cmd + Shift + P > Show Layers Panel).
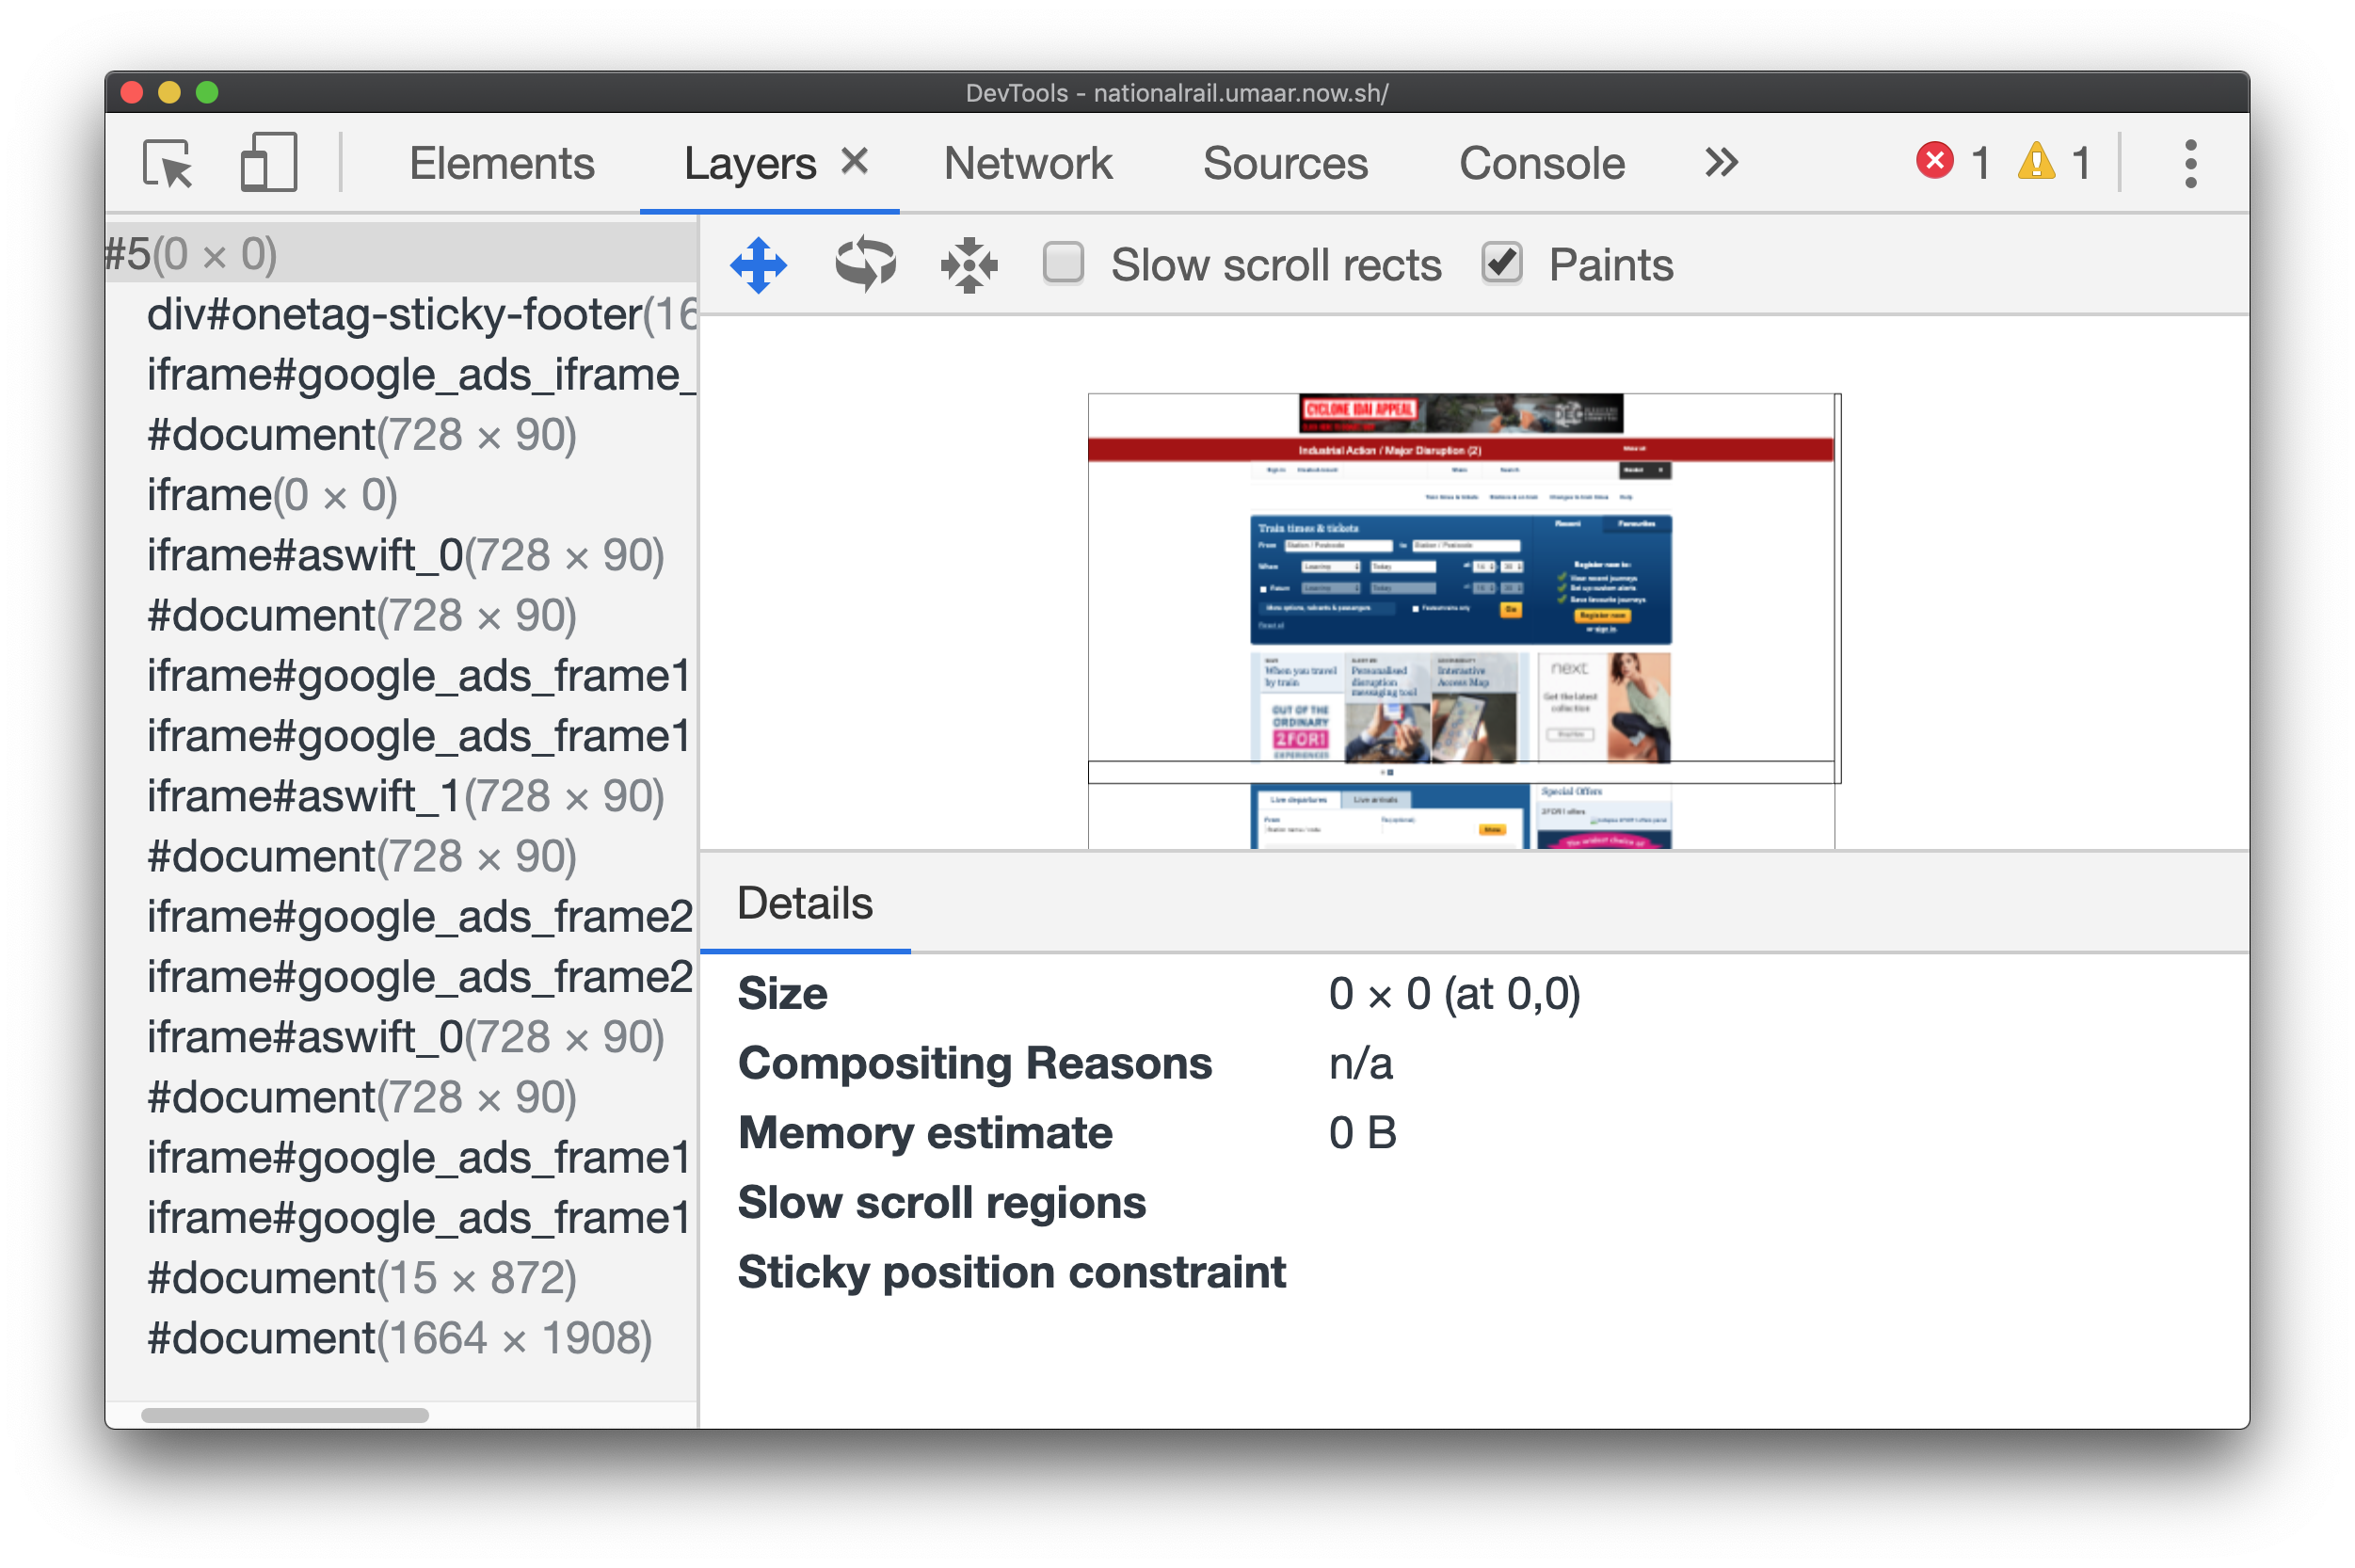
Layers Panel
The Layers Panel gives a 3D representation of the layers on the currently inspected page. On this page, there is a very large layer which DevTools estimates to need almost a gigabyte of memory.
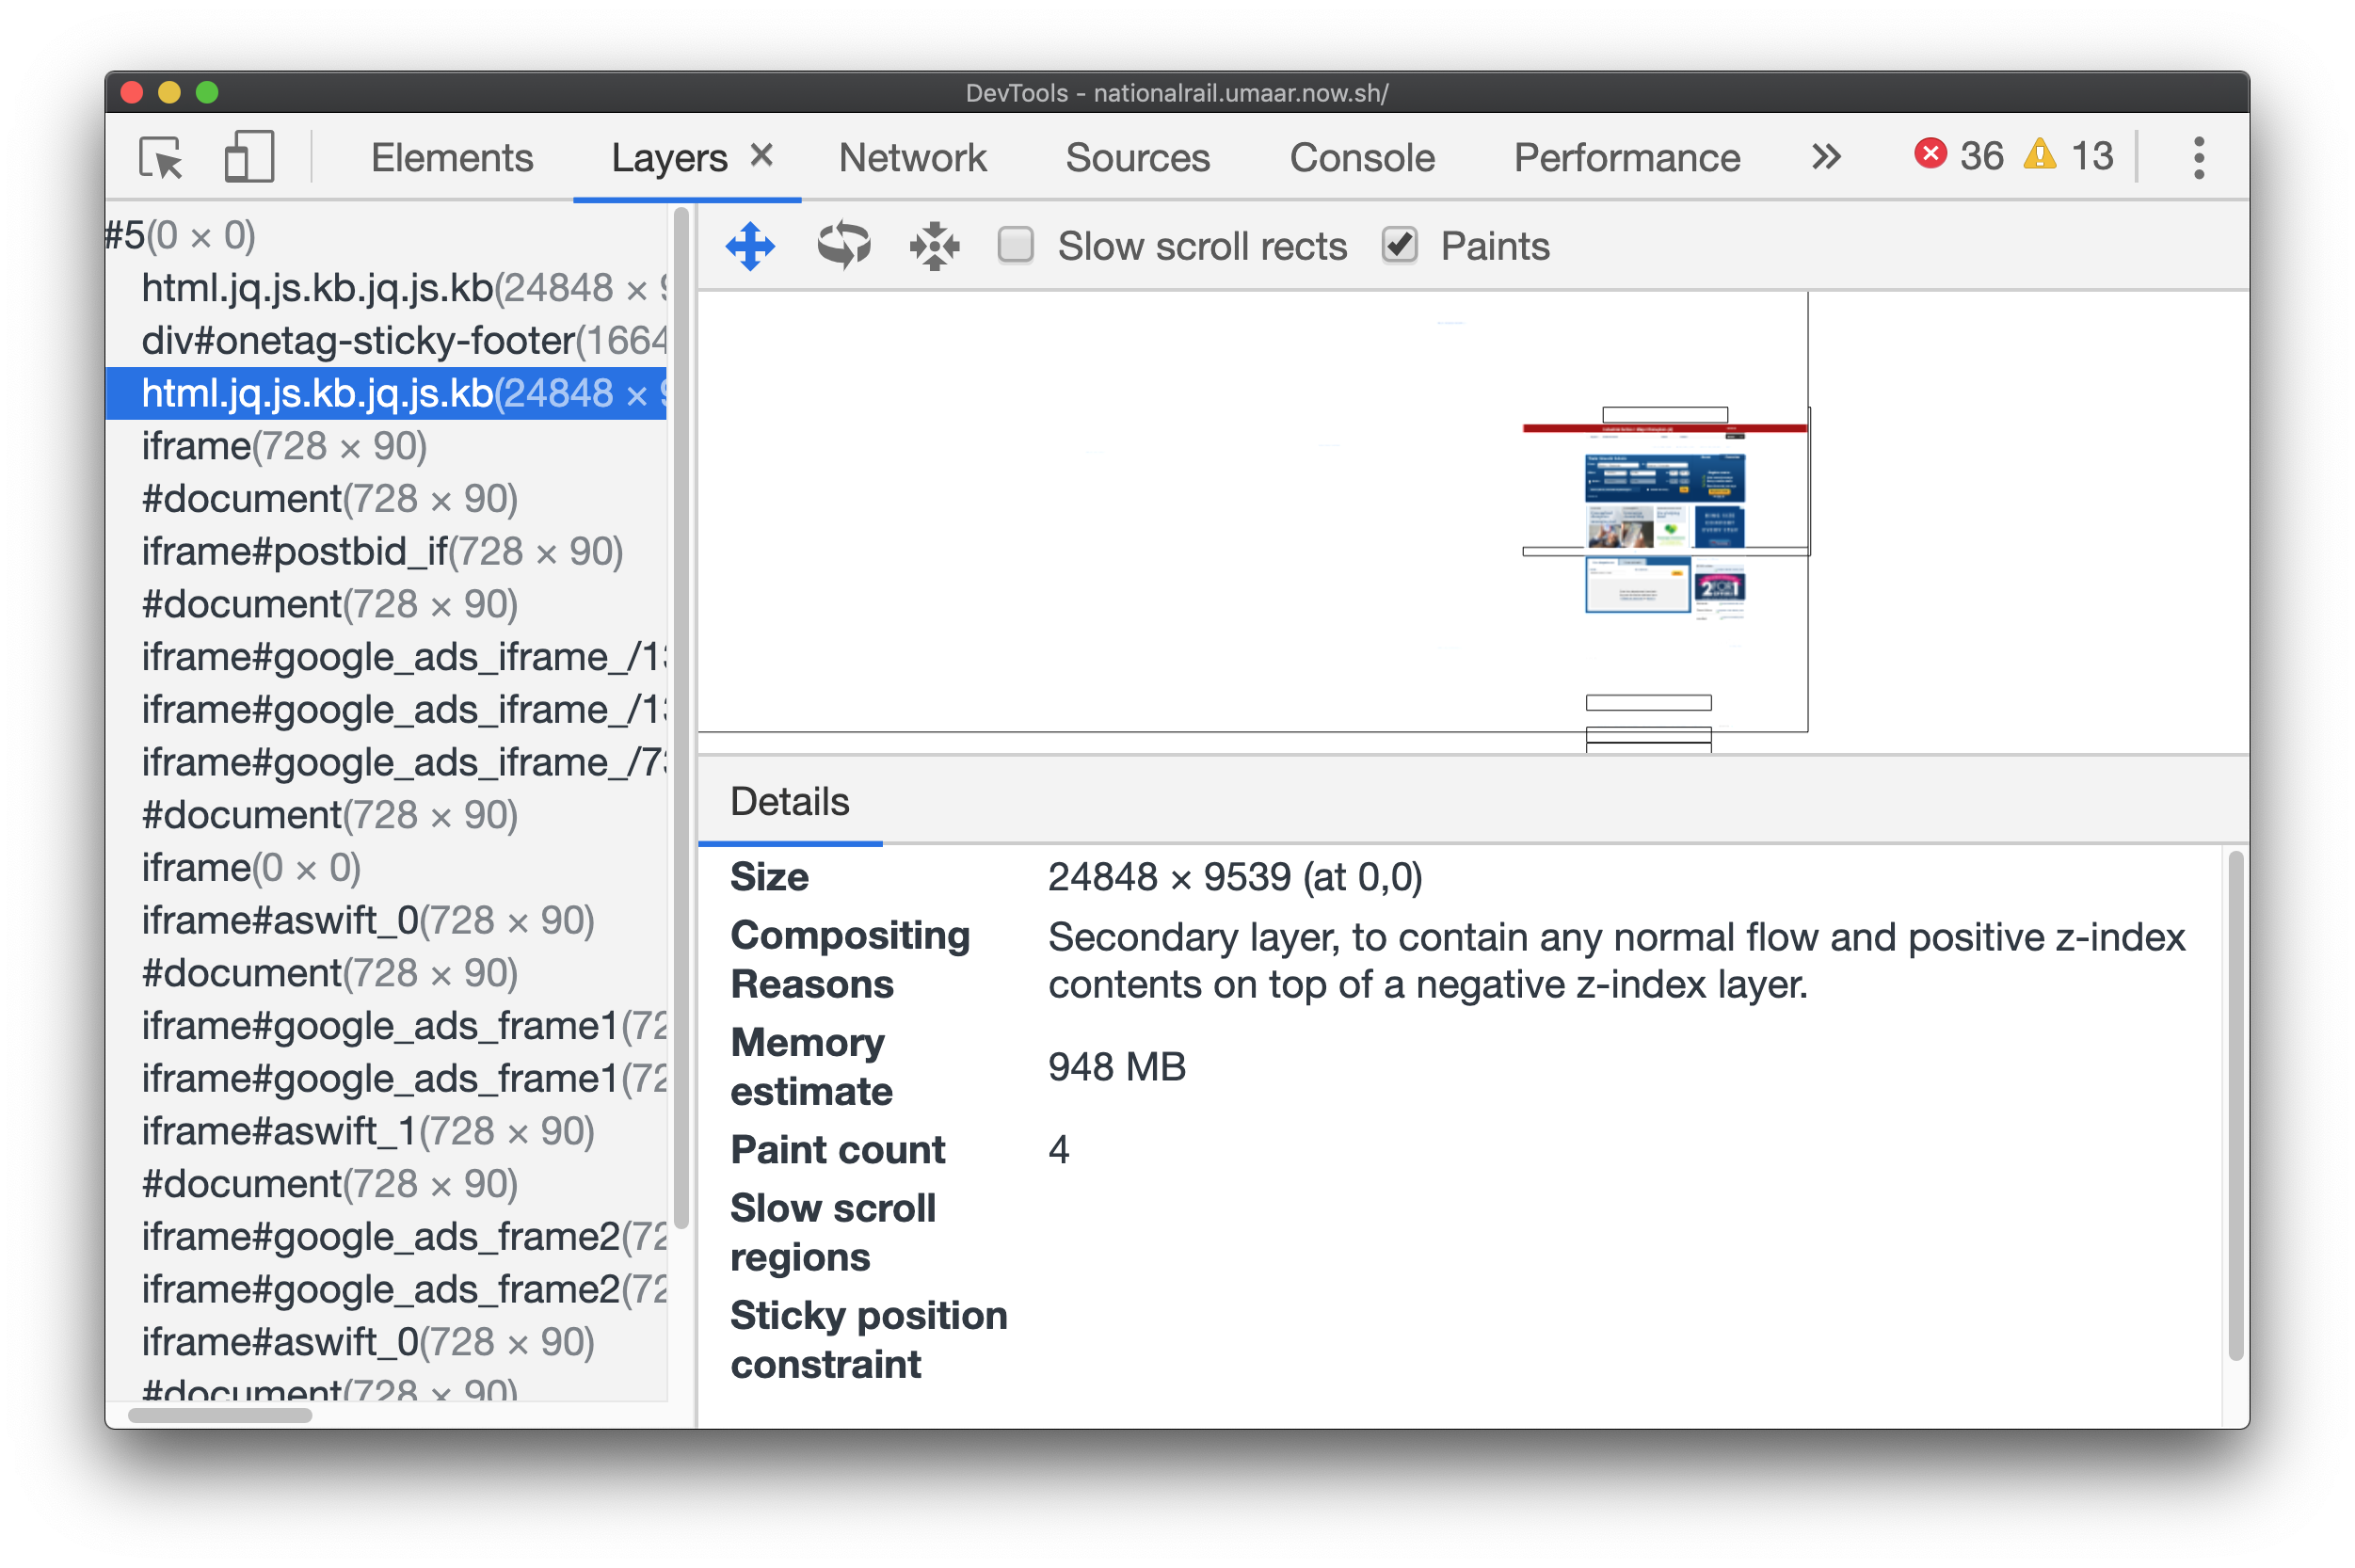
The compositing reason suggests that the parent element has children with a negative z-index, which resulted in this element being promoted to its own layer.
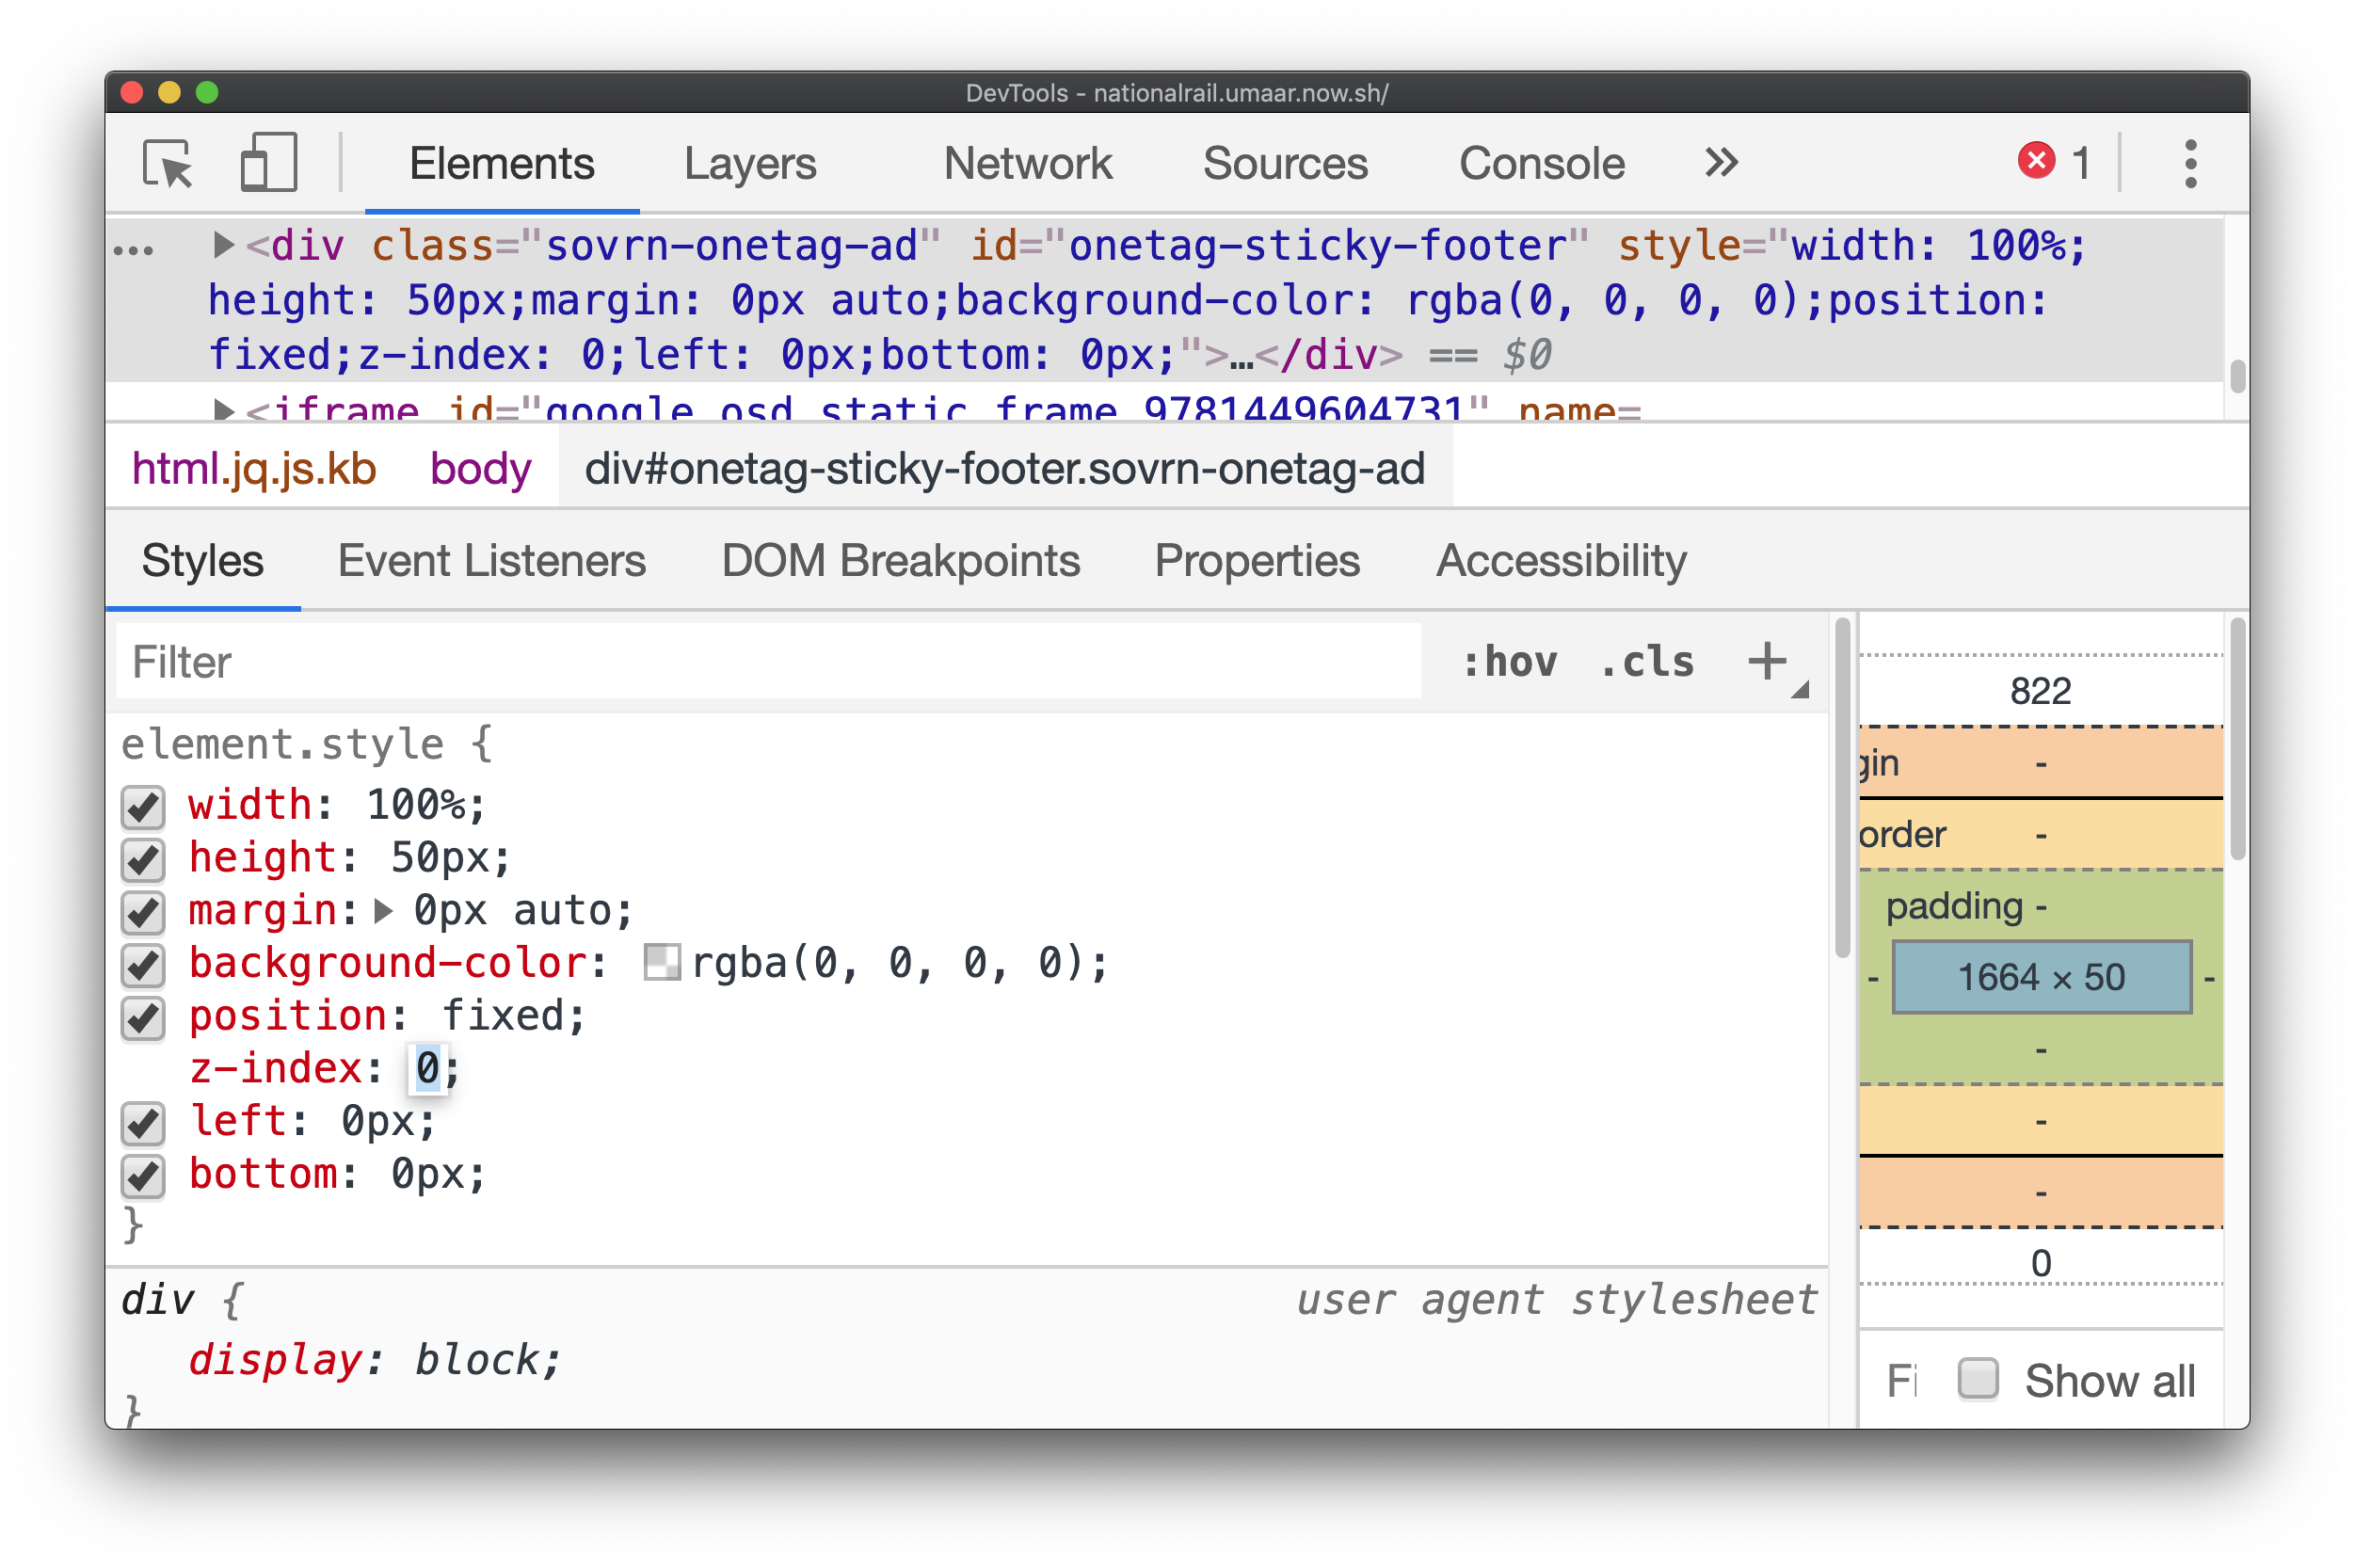
Changing the z-index
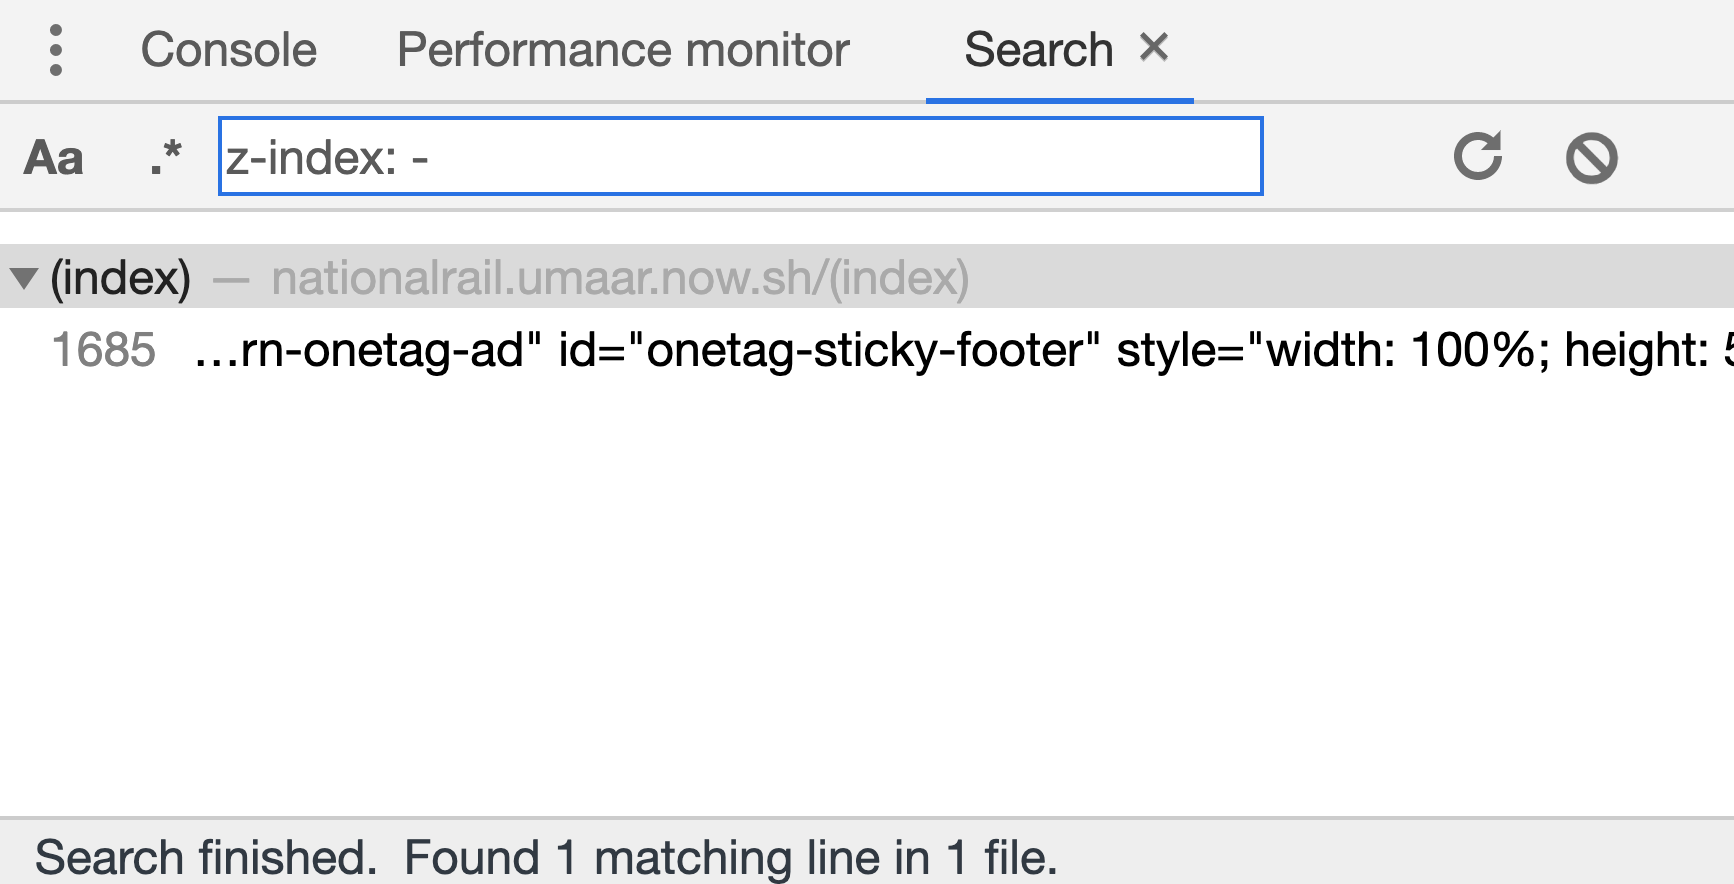
To find the element(s) with a negative z-index, we can construct a project wide search using the shortcut: Cmd + Alt + F and search for z-index: -.
As an experiment, if we change the z-index of the found element to 0, improvement can then be seen in the Layers Panel.
Conclusion
Note 1: In reality, such a "fix" would need much more in-depth testing, as well as an understanding of the reason for the negative z-index in the first place.
Note 2: If you're following along at nationalrail.umaar.now.sh, you may occasionally see yet another large layer appear which consumes a decent chunk of memory. This didn't happen for me consistently, but when it did occur, it seemed to be related to another z-index property on another element.